Know this, set up your systems to calculate it, let the data come in, and then use it. Your reps will improve, your cost of acquisition will go down, and you will be loved. Have your sales ops analyst set it up now. You’ll thank yourself.
Opportunity Velocity tells you how effective your effort is by returning the average dollars brought in per day and is defined as:
[(Total # of opportunities) * (Win rate) * (Average ARR of closed won opps)] / (Sum of pipeline age).
Let’s look at an example that would yield an increase in revenue by focusing energy towards opportunities with a higher velocity.
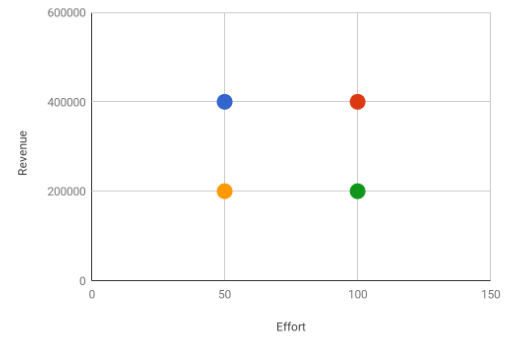
In the image below you see a scatterplot (velocity vs. total revenue) where four dots have been plotted.

Takeaways:
- If these dots were sales reps, Blue and Red closed the same amount of revenue, but Blue is twice as efficient with her time. And, Red gets it done with brute force and a lot of man-hours. The goal here is to improve Red’s efficiency by isolating what Blue does best. Another goal is to incentivize Blue to put in more effort. Oh, and Green needs desperate coaching (they are working hard, but hardly efficient).
- If these dots were market segments, Green is a terribly inefficient and a resource-gobbling market segment. Abandon it and reallocate your resources to other market segments. Blue is the front-runner for being the golden goose and centering a team and acquisition strategy around that market-segment.
There are no less than 10 other examples that would drive important change in an organization (e.g. adjust marketing spend based on a more complete understanding of your best lead sources, aligning territories with highest yield).